
|
To add an app instance Data List or Grid to a report: |

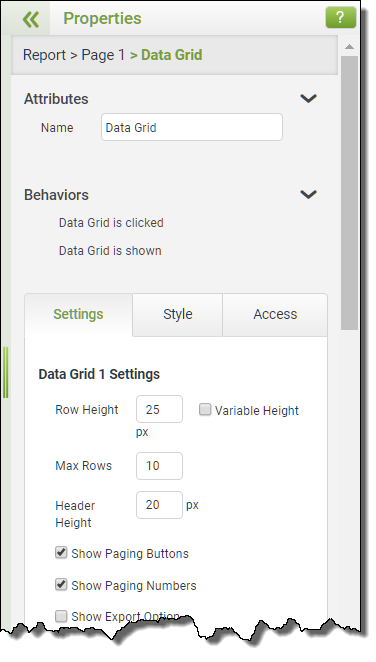
1.With a report loaded in the Report Designer Layout view, drag a Data List/Grid object onto the layout canvas. 2.Select the Data List/Grid object. 3.On the Properties panel, select from the following appearance properties: •Row Height (in pixels) •Max Rows - The number of rows to display •Variable Height - Check this box to enable auto-sizing of rows. This option ensures that all data is shown in each row, regardless of how much it contains. •Header Height (in pixels) - Adjust this setting to change the height of the header columns. Increase this property if the header text is long enough to wrap to another line. •Buttons - Select the buttons to be displayed to the report user. These include Navigation, Export and Paging Number buttons. Check Export to allow users to download the contents of the Data List in a CSV or XML file. 4.Choose the State for the reporting object. Select from Default, Normal, Disabled or Hidden for Data List objects. With field state management, you control access to individual objects on the report. You can prevent individual users from changing or even viewing specific data or sections of the report. |
 |
||||
5.In the Data section of the Data List/Grid Properties, select the app you are reporting on from the Data Source list.
6.In the Columns section below it, click the Add Column 7.Select a row in the Columns list. 8.Click in the Caption field for the selected row and enter the column title. 9.For Data Grid Only: Choose an aggregation option. You may select either group or a function used to aggregate the data for the field selected below.
10.Choose the associated field to report on from the list in the Field drop-down below the Columns grid. 11.Choose to Sort the data list by ascending or descending order and optionally set a fixed width for the Data List object. 12.Choose a width in pixels for that data in the report. 13.Choose the alignment of the column value - left, center or right. 14.Choose to hide or show the column by clicking the Hidden check box. 15.Choose to include this column in dynamic filtering. (See also 16 below) 16.Choose the Format of the field. Options include: •None •Number - Use this for currency and other number formats. Optionally show decimal places and a currency symbol. •Date - Use this format for date fields and choose the month, day, year order. •Time - Use this format for time inputs and optionally show a 24-hour clock and seconds. •Boolean (Yes No) - Use this format for checkbox inputs. Optionally assign values to the Yes/No options. Note that if the Boolean format is selected but nothing is entered into the Yes or No boxes, then nothing will be listed in the reports. •Percentage - Use this format for numeric inputs that contain percentages. 17.Repeat steps 7 - 16 for any additional columns. 18.Choose any filtering or other miscellaneous options as needed. |
 |
||||
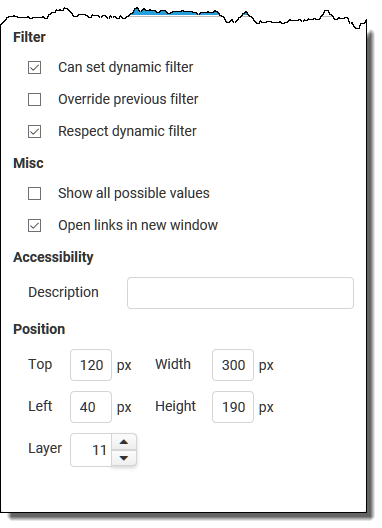
•Can Set Dynamic Filter - This option tells PerfectApps that any click within the selected reporting object should be broadcast to all other objects on the report. Unchecking this option means no drill-down will occur when the object is clicked. •Override Previous - By default, each object that you click on for a drill-down remains in effect when subsequent objects are selected. In other words, the drill downs you select are cumulative. However, you may want a drill-down selection to clear all other existing drill-down filters before performing its own drill-down. In this case, you would select the Override Previous check box. •Respect Dynamic Filter - This option tells PerfectApps that any drill-down event broadcast from another reporting object should be respected, and so it should filter its data. Unchecking this option means the object will not respond to a drill-down event from another object. •Show All Possible Values - If this is checked, then it will include values where there is a result of 0. If left unchecked, 0-value results will be omitted from the list. •Open Links in New Window - Uncheck this default option to open the linked instance in the existing browser tab. Otherwise, the default action will be to open linked items in a new browser tab. |
 |

 button to add columns to the data list.
|
Data List (5 min) |
The Data List is a table reporting object which can be used to display data from many different fields on the linked app. In this tutorial you will also see how that can be adapted to become an access portal by including a link to the individual app instances. |
|
Data Grid (3 min) |
The Data Grid offers similar features to the Data List but with the added option of being able to aggregate data for a field, or fields, on the app. Typically this would be used to see the total value of orders by department. |

See also: Delegating Sort Order for Data Lists or Grids, Adding a Gauge
Return to: Adding Objects to Your Report, Designing a Report
